CLIMATE CHANGE: THE BIG PICTURE

 Climate Pulse is part of the Copernicus Climate Change Service which provides maps, charts and timelines of measured air and sea temperatures from 1850 onward. A more comprehensive data set is found in the Copernicus Interactive Climate Atlas, which also contains projections of how soon your region of the world will surpass 1.5°C or 2°C if it hasn’t already. This is displayed as a graph or “climate stripes.”
 The Climate Toolbox is a collection of web tools for visualizing past and projected climate and hydrology of the contiguous United States. Includes future crop suitability, future streamflows, future climate scenarios at specific locations, future climate in tribal regions, and lots of historic data for a region. The Climate Toolbox Tool Summaries explains several of the tools and Case Studies show how people in different jobs use the tools. Applications lists the tools appropriate for Agriculture, Climate, Fire and Water.
![]()
 The Climate Change Tracker is a set of dashboards of up-to-date estimates of policy-relevant global climate indicators reported to the Intergovernmental Panel on Climate Change (IPCC). These indicators follow the causal chain from emissions (CO2 dashboard, Methane dashboard, N2O dashboard) to Global Warming (dashboard), including greenhouse gas emissions, human induced warming and the remaining global carbon budget. The methodologies used to update the indicators are directly traceable back to the IPCC Sixth Assessment Report (AR6). The data is based on the most recent data from the Indicators of Global Climate Change Collaboration, Global Carbon Project, and the PRIMAP-hist national historical emissions time series.
The Trump Administration has stopped collecting and hosting a multitude of climate data. Some of the links below may be out of date or broken.
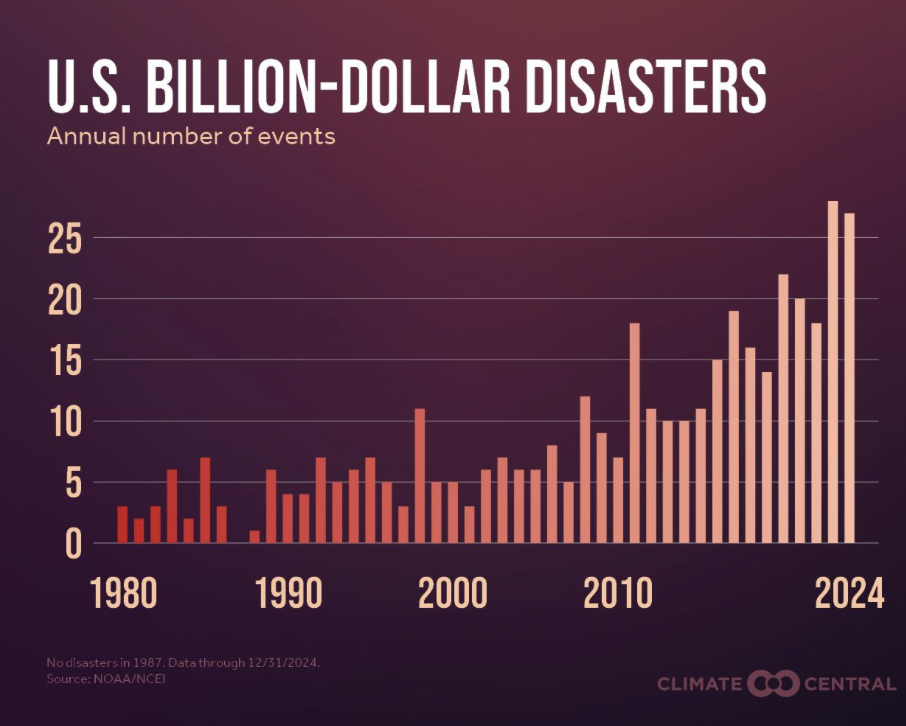 Climate Central has achieved the NOAA U.S. Billion-Dollar Disasters: 1980-2024.
 The National Oceanic and Atmospheric Administration (NOAA) has dashboards that track climate change and natural variability over time. Indicators include the annual greenhouse gas index, arctic sea ice summer minimum, mountain glaciers, ocean heat content, global sea level, northern hemisphere spring snow, incoming sunlight, global average surface temperature, arctic oscillation, North Atlantic Oscillation, El Niño and La Niña Oceanic Niño Index, Pacific-North American Pattern and Southern Oscillation Index.
 It also provides up-to-date, free-to-use U.S. and global weather and climate maps of averages, outlooks and projections of temperature, precipitation, snow and ice, oceans, drought and severe weather.
A climate primer explains the difference between climate and weather, how climate is determined today and in the past and how to find the data you need on the website. News & Features and Research Highlights contain the latest on climate and weather. An event tracker links recent events to climate.
 Tools & Interactives section includes links to a variety of tools including an image slider of Colorado’s June 2018 wildfires, historic summer heat in the U.S. web map, and the NOAA View Data Exploration Tool, which allows you to create world maps of indicators such as sea and land surface temperatures, ice cover and temperatures in different atmospheric levels over different time periods
ATTRIBUTION SCIENCE
Weather Events Attribution How much more likely did climate change make a heat wave or hurricane to occur, for example.
CLIMATE CHANGE IMPACTS
Climate Central U.S. Climate Shift Index Map The CSI is a categorical scale, with the categories defined by the ratio of how common (or likely) a temperature is in today’s altered climate vs. how common it would be in a climate without human-caused climate change.
NOAA Tools includes climate resilience kit, local climate projections
 Drought.gov. The National Integrated Drought Information System (NIDIS) is a multi-agency partnership that coordinates drought monitoring, forecasting, planning, and information at national, tribal, state, and local levels.
PUBLIC OPINION
Public Understanding and Opinions about Global Warming Maps
HEALTH
![]() Heat.gov Heat related illnesses and death are largely preventable with proper planning, education, and action. Heat.gov serves as the premier source of heat and health information for the nation to reduce the health, economic, and infrastructural impacts of extreme heat. Tools.
Heat.gov Heat related illnesses and death are largely preventable with proper planning, education, and action. Heat.gov serves as the premier source of heat and health information for the nation to reduce the health, economic, and infrastructural impacts of extreme heat. Tools.


Extreme heat events have long threatened public health in the United States. The CDC Heat & Health Tracker provides local heat and health information so communities can better prepare for and respond to extreme heat events. You can see e how extreme heat affects your county, populations who are at risk, and response resources. It also has a useful Resources page, videos and historical, current, and projected data and maps on heat and heat-related illness.